2025 Global Bitcoin Hash Rate Distribution by Country

Bitcoin Hash Rate Distribution Explorer
Top Countries by Hash Rate Share
Distribution Visualization
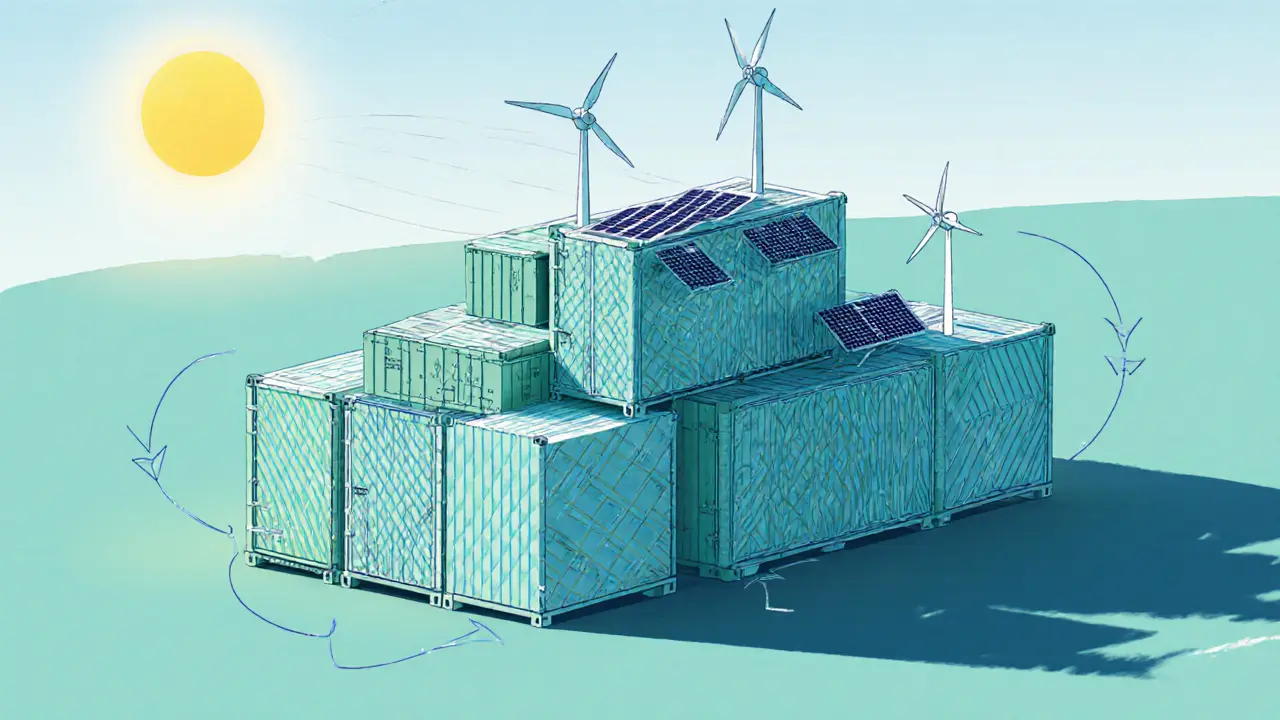
Energy Sources & Sustainability
Iceland
92% renewable
Geothermal & hydro
Norway
96% renewable
Hydropower
Canada
Hydro
Alberta, Quebec
Key Insights
- The U.S. dominates with 44% of global hash rate
- Renewable-rich nations lead in sustainability
- Regulatory clarity drives mining cluster formation
- Newer ASICs improve efficiency by 35%
- Energy costs remain key competitive factor
Quick Takeaways
- The Bitcoin network runs at roughly 1,020.71EH/s as of October2025.
- The United States supplies about 44% of global mining power, followed by Kazakhstan (12%) and Russia (10.5%).
- Renewable‑rich nations like Iceland and Norway dominate sustainable mining, powering over 90% of their hash rate with green energy.
- Regulatory clarity and cheap electricity remain the biggest drivers of where hash rate clusters.
- Next‑gen ASICs improve efficiency by ~35%, allowing operators in higher‑cost regions to stay competitive.
When tracking Bitcoin hash rate distribution is a metric that shows where the mining power behind the Bitcoin network is physically located, measured in exahashes per second (EH/s). Understanding this geographic spread matters because it reveals the network’s security, decentralisation, and the geopolitical forces shaping the cryptocurrency economy.
What the Metric Really Means
Bitcoin’s proof‑of‑work consensus relies on miners solving cryptographic puzzles. The combined computational speed of all miners is called the hash rate. By analysing where those machines sit - via IP geolocation of mining pool nodes - we get the hash‑rate distribution. This tells us which countries hold the most influence over block creation and, indirectly, over transaction confirmation times.
How Hash Rate Is Measured
Every 2,016 blocks (about two weeks) the network adjusts its difficulty to keep block times near ten minutes. The difficulty, together with the observed block discovery rate, lets us back‑calculate the total network hash rate. Mining pools such as BTC.com, Poolin, ViaBTC and Foundry publish the IP addresses of their servers; analysts then map those IPs to countries. While VPNs and proxies can muddy the picture, the Cambridge Centre for Alternative Finance (CCAF) cross‑checks data with on‑ground partnerships, giving the most reliable monthly snapshots.
2025 Global Numbers at a Glance
As of October2025 the Bitcoin network sits at roughly 1,020.71EH/s, with the all‑time high of 1,441.84EH/s recorded on 20September2025 (block915,533). Mining rewards - block subsidies plus transaction fees - topped $11.2billion for the year, marking a 7.1% increase over 2024.
Geographic Breakdown
Below is the latest country‑level snapshot, based on CCAF’s November2025 report.
| Country | Share of Global Hash Rate | Primary Energy Source | Key Regulatory Trait |
|---|---|---|---|
| United States | 44% | Mix of natural gas, wind, solar (state‑level incentives) | Clear federal stance, state‑level competition (e.g., Texas deregulated market) |
| Kazakhstan | 12% | Coal and natural gas (low‑cost) | Generous tax breaks, but recent policy uncertainty |
| Russia | 10.5% | Flare gas & hydro‑thermal (sub‑arctic cooling) | Support for flare‑gas mining, limited international sanctions impact |
| Canada | 9% | Hydro (Alberta, Quebec) | Stable regulatory framework, strong grid capacity |
| Iceland | 5% | Geothermal & hydro (92% renewable) | Pro‑mining licensing, low‑tax environment |
| Norway | 3% | Hydropower (96% renewable) | Strict environmental permits, but generous renewable subsidies |
| Iran | 4.2% | Mix of fossil & hydro | Sanctions and energy rationing limit growth |
Energy Consumption and Sustainability
The Bitcoin network’s electricity footprint in early 2022 briefly eclipsed Finland’s entire power usage. By 2025, the annual consumption stabilised at roughly the level of Australia (≈ 300TWh) thanks to improved ASIC efficiency and a shift toward greener power. The next‑generation ASICs released in 2024 achieve about 0.02W/TH, a 35% boost over the previous generation, allowing miners in high‑cost locales to stay viable.
Renewable‑heavy regions (Iceland, Norway, Quebec) attract ESG‑focused investors. In Iceland, over 92% of mining operations run on geothermal and hydro, while Norway boasts a 96% hydropower share. This not only lowers carbon intensity but also provides natural cooling, reducing the need for expensive chill‑water systems.
Regulatory & Market Dynamics
Clear legal frameworks act like magnets for hash power. The United States benefits from a patchwork of state incentives - Texas offers deregulated electricity markets; Wyoming provides pro‑mining legislation. Conversely, countries with ambiguous policies (e.g., parts of Africa) see capital outflows.
Kazakhstan’s mining boom exploded after 2021 when it offered a 3% tax on mining revenue. Recent tax revisions have introduced uncertainty, prompting some operators to scout alternative sites.
Russia leverages stranded flare gas, turning waste into mining revenue. The sub‑arctic climate also reduces cooling costs, making otherwise expensive electricity more attractive.
Technological Drivers of Redistribution
ASIC efficiency (watts per terahash) is the core metric guiding location decisions. For example, a miner in Texas paying $0.05/kWh with a 0.025W/TH ASIC can achieve a comparable profit margin to a miner in Norway paying $0.08/kWh with a 0.015W/TH ASIC. The trade‑off hinges on electricity price vs equipment cost.
Infrastructure - stable internet, grid capacity, physical security - also skews distribution toward developed economies. Emerging markets that invest in fiber optic backbones and grid upgrades could gradually capture more share.
Future Outlook
Looking ahead, three forces will shape the next wave of distribution:
- Regulatory certainty: Nations that codify mining‑friendly policies while enforcing environmental standards will likely dominate.
- Renewable integration: Projects that combine mining with excess renewable generation (e.g., solar farms in Chile, wind farms in Texas) will boost hash rate in those regions.
- Equipment evolution: ASICs that push watts‑per‑terahash below 0.015W/TH could make high‑cost electricity markets (e.g., parts of Europe) economically viable again.
Institutional investors are increasingly demanding transparency on carbon footprints. Expect more mining firms to publish sustainability reports, and for exchanges to favour coins mined in low‑carbon jurisdictions.
Key Takeaways for Investors and Miners
- Monitor regulatory changes in Texas, Kazakhstan, and the Nordics - they drive 70% of the hash rate.
- Factor in equipment efficiency; next‑gen ASICs can offset higher electricity rates.
- Consider ESG alignment - green‑powered hash rate is becoming a premium asset.
Frequently Asked Questions
Why does the United States hold the largest share of Bitcoin hash rate?
The U.S. offers a mix of low‑cost natural‑gas electricity, state‑level tax incentives, and a reliable grid. Texas, in particular, has a deregulated market that lets miners negotiate favorable power contracts, while Wyoming and other states provide mining‑friendly legislation.
How accurate is IP‑based geolocation for measuring hash‑rate distribution?
IP mapping gives a solid macro view, but VPNs, proxies, and cloud‑based mining pools can skew results. The Cambridge Centre cross‑references pool‑level data and on‑ground reports to reduce error, though a small margin of uncertainty remains.
Can miners in high‑price electricity regions stay competitive?
Yes, if they use the latest ASICs with superior efficiency or pair mining with excess renewable generation. Some operators co‑locate with solar farms that sell surplus power back to the grid, reducing net electricity costs.
What impact could future regulation have on hash‑rate distribution?
Tightening environmental rules could push miners toward greener jurisdictions, while clear mining licences in new regions (e.g., parts of South America) could attract fresh hash power. Conversely, sudden bans-like China’s 2021 crackdown-can cause rapid geographic shifts.
Is a 51% attack still a realistic threat given today’s pool distribution?
Current pool shares are spread across dozens of operators, with the largest (BTC.com) holding just under 20%. While concentration risks exist, no single pool controls a majority, making a coordinated 51% attack logistically difficult and economically unattractive.
Fionnbharr Davies
September 23, 2025 AT 13:53When we look at the 2025 hash‑rate map, we see more than numbers; we see the shifting balance of power across continents.
Each percentage point represents massive capital, political will, and ecological choice.
The United States, holding 44 %, is not just a statistical lead but a reflection of a diversified energy portfolio that blends cheap natural gas with burgeoning renewables.
Kazakhstan’s 12 % share tells a story of low‑cost fossil fuels, yet also of regulatory volatility that could reshape its trajectory.
Russia’s 10.5 % underscores how flare‑gas capture can turn waste into mining revenue, while its sub‑arctic climate offers natural cooling advantages.
Canada’s 9 % showcases the power of hydro‑electric infrastructure and stable policy frameworks that attract long‑term investors.
Iceland, despite its modest 5 %, exemplifies how geothermal and hydro can power a nation’s mining sector with over 90 % renewable energy, setting a benchmark for sustainability.
Norway’s 3 % may appear small, but its 96 % renewable hydropower ensures exceptionally low carbon intensity per hash.
Iran’s 4.2 % illustrates the complex interplay of sanctions, mixed energy sources, and a still‑evolving regulatory environment.
These geographic slices together form a tapestry where energy cost, legal clarity, and climate all intertwine to shape where miners locate their machines.
The drop from the all‑time high of 1,441 EH/s to the current 1,020 EH/s reflects both the efficiency gains of the 2024 ASIC generation and a market correction after the 2022 energy crisis.
ASICs that now achieve 0.02 W/TH have reduced the electricity appetite of a typical mining farm by roughly a third, enabling profitability even in higher‑cost regions.
Nevertheless, electricity pricing remains the single most decisive factor; a miner paying $0.05/kWh in Texas can compete with a Norwegian operation at $0.08/kWh when the hardware efficiency gap narrows.
The ongoing push for renewable integration-solar farms in Chile, wind farms in Texas-will likely redistribute hash‑rate toward greener locales in the next few years.
Ultimately, the hash‑rate distribution is a mirror of global energy policy, technological progress, and the economic incentives that drive miners to seek the lowest marginal cost while navigating geopolitical currents.
Enya Van der most
October 1, 2025 AT 12:10Whoa, this data is electrifying! 🚀 Seeing the U.S. dominate with 44 % really shows how state‑level incentives can spark a mining boom. The colors of the chart practically shout "green power" for Iceland and Norway-talk about a renewable rave! And let’s not forget Kazakhstan’s cheap coal‑fuelled surge; it’s a wild ride of cost versus climate. Keep those numbers coming, folks-this is the kind of high‑energy info that fuels our crypto dreams!
Megan King
October 9, 2025 AT 10:27nice breakdown, really helpful. i think the mix of gas and renewables in the us makes sense for both cost and reliability. also, the fact that 2024 ASICs are way more efficient means even places with pricier elec can stay in the game. good job on the details!
Rachel Kasdin
October 17, 2025 AT 08:44Look, while everyone’s waxing poetic about renewables, the fact remains the US is where real freedom and power live. 44 % isn’t just a number-it’s proof that our market‑driven energy system beats any socialist‑styled subsidies abroad. If you’re not mining here, you’re missing the biggest prize.
Nilesh Parghi
October 25, 2025 AT 03:12One could argue that the distribution of hash power mirrors the age‑old philosophy of balance between nature and human ingenuity. In the same way that ancient scholars sought harmony, modern miners now chase the equilibrium of cost, climate, and code. The data is a modern parable, reminding us that technology does not exist in a vacuum but is interwoven with the land it occupies. Where the rivers flow, so too do the bits of computational might, and where the wind blows, so does the promise of sustainable proof‑of‑work. It’s a reminder that every megawatt of green power fuels not just lights, but the very ledger of decentralized trust.
Noel Lees
November 1, 2025 AT 23:14🌟 Wow, that was a deep dive! It’s amazing how philosophy meets tech in the mining world. Curious to see how next‑gen ASICs will shift the balance-maybe even give smaller nations a chance to shine. Keep the insights coming! 😊
Adeoye Emmanuel
November 9, 2025 AT 20:08The precision of the figures is striking; a 35 % efficiency boost is not merely a statistic but a catalyst for geopolitical realignment. When miners in high‑cost regions can finally break even, the magnetism of cheap, renewable‑rich zones may weaken, yet the allure of stable policy will persist. The convergence of economics and environmental stewardship paints a complex portrait, one that demands both analytical rigor and visionary foresight.
Raphael Tomasetti
November 17, 2025 AT 17:03Hash‑rate distribution = function(energy_cost, regulatory_clarity, ASIC_efficiency). Optimize these variables to maximize ROI.
Jenny Simpson
November 25, 2025 AT 13:58Ah, the classic equation! But what if the hidden variable is geopolitical sentiment? A sudden policy swing could overturn even the most perfectly balanced model, sending shockwaves through the entire network-like a plot twist no one saw coming.
Sabrina Qureshi
December 3, 2025 AT 11:09Wow!!! This is sooo helpful!!!!
Rahul Dixit
December 11, 2025 AT 08:04Don't be fooled by the clean energy headlines; behind the curtain, shadowy cabals are pulling the strings of power distribution, ensuring that the real beneficiaries are the elite financiers who thrive on secrecy and manipulation.
Kamva Ndamase
December 19, 2025 AT 04:58While we respect the need for vigilance, it’s also vital to recognize the genuine progress many nations have made toward greener mining. Let’s channel that energy into collaborative solutions rather than divisive speculation.
Thiago Rafael
December 27, 2025 AT 01:53According to the latest Cambridge Centre for Alternative Finance report, the United States' 44 % share is primarily driven by deregulated electricity markets and state‑level mining incentives. Additionally, the 2024 ASIC efficiency improvements of approximately 35 % have lowered the threshold for profitability across all regions, as corroborated by third‑party mining profitability calculators. Therefore, the observed distribution aligns with established economic models and does not constitute any anomalous activity.
Janelle Hansford
January 3, 2026 AT 22:48Great job pulling all this together! It’s encouraging to see such a clear picture of where the industry is headed, especially with the push toward greener power sources. Keep the updates coming-optimism is contagious!
Krystine Kruchten
January 11, 2026 AT 19:42Thanks for the thorough analysis. It's clear that policy clarity and tech innovation are driving the current hash‑rate landscape. Keep up the good work, it's really insightful!